Continuation and reversal patterns are the bread and butter of anyone trying to decode market behavior.
Continuation patterns are the temporary consolidation phase in an ongoing trend whereas reversal patterns are the potential indication of trend exhaustion. The tricky part is that chart patterns can look suspiciously alike, so the real skill is learning to read them in context.
Done right, they may help inform trading decisions in a volatile market—so let’s dive in!
Continuation vs. reversal patterns
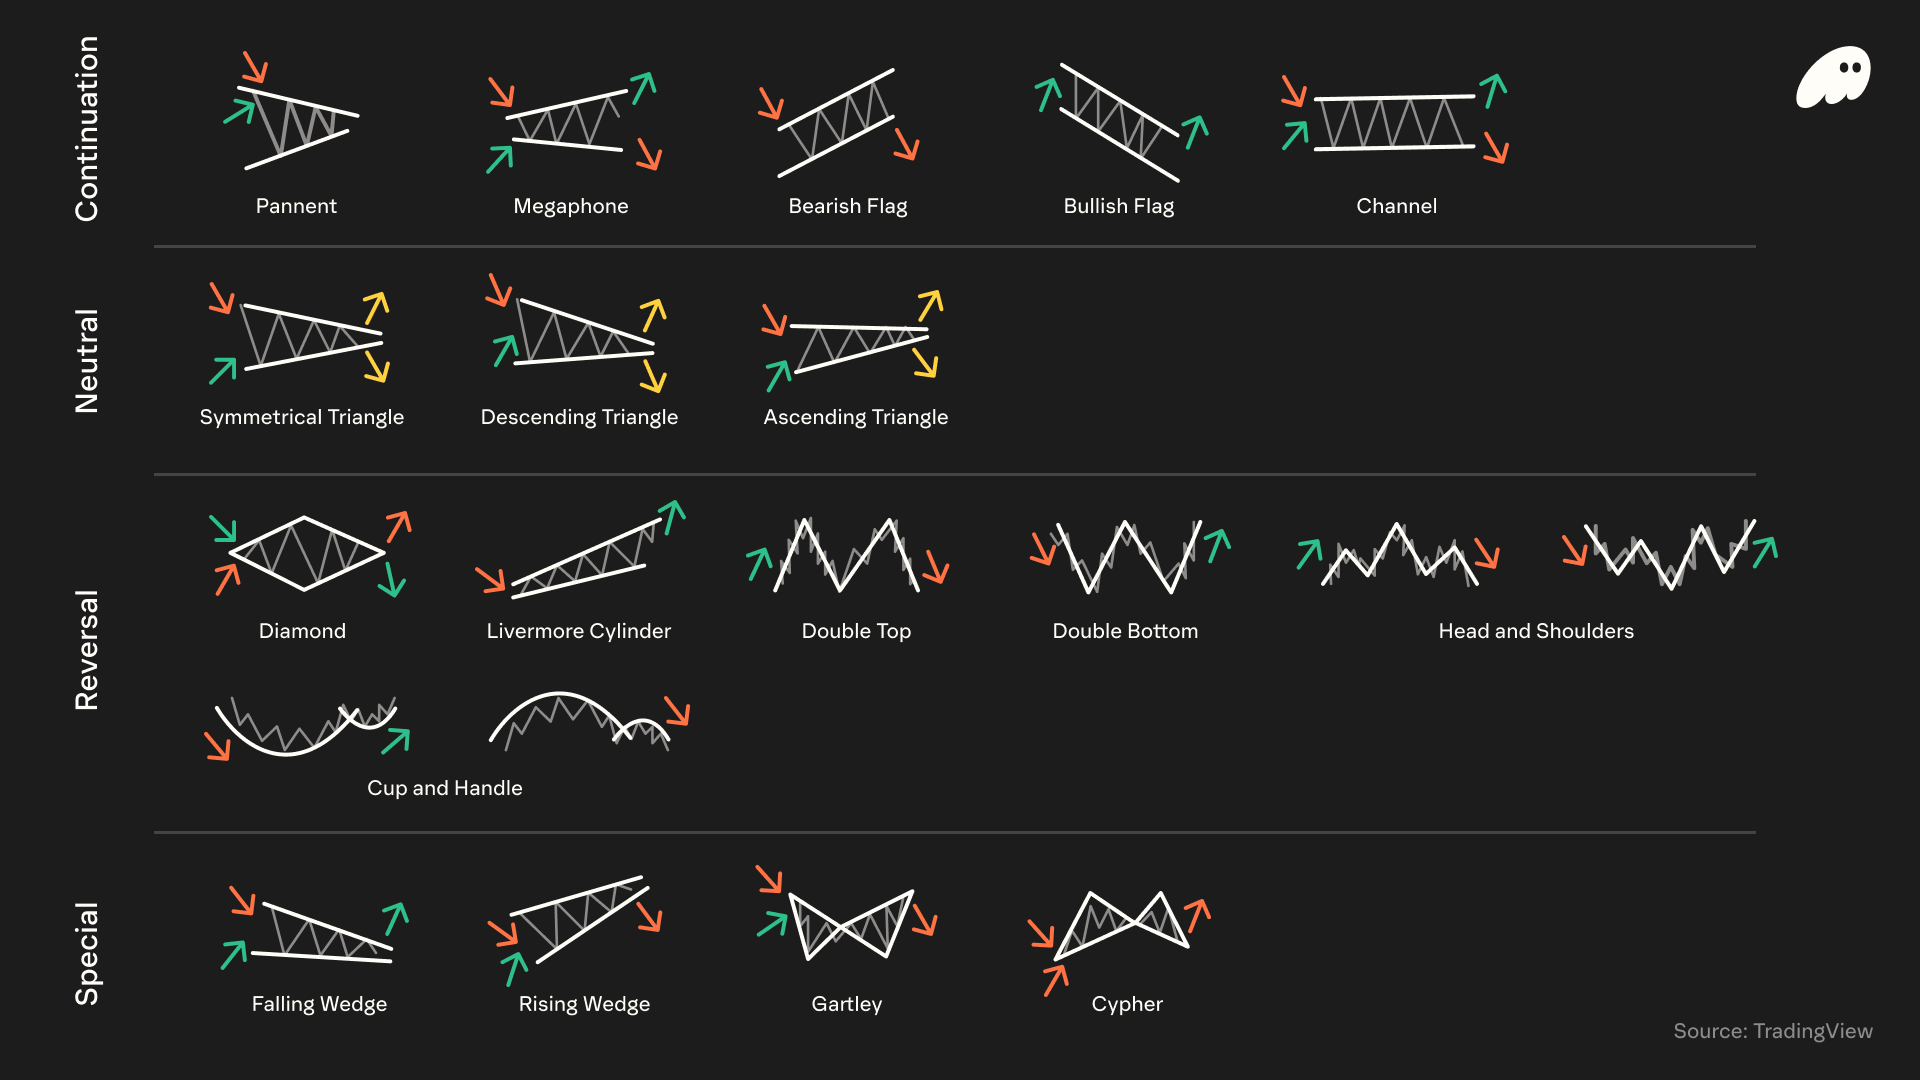
Chart patterns are visual setups that may hint at where the price might go next. These patterns generally fall into two broad camps: continuation patterns and reversal patterns.
A continuation pattern suggests that an ongoing price trend will potentially pick up again after a brief pause, allowing traders to “continue” riding that trend. On the other hand, a reversal pattern signals that the current trend might be weakening, though reversals are never guaranteed.
By clearly defining these two camps of patterns, traders can develop a framework for analysis, though no pattern or strategy eliminates the risk of losses.
Continuation patterns: Momentum at rest
Continuation patterns occur in the middle of an existing trend and are often described as “momentum at rest.”
Think of a strong trend that takes a temporary pause. The price may stall or move sideways for a while, but importantly, it doesn’t significantly go against the original trend. This pause often happens because some traders in the trend are taking profits or hesitating, yet not enough opposite pressure exists to fully reverse the trend.
Common continuation patterns include flags, pennants, and triangles, among others.
Reversal patterns: Trend exhaustion
Reversal patterns form after a sustained trend and indicate potential trend exhaustion—the current uptrend or downtrend is losing strength and may soon reverse direction.
In an uptrend, a reversal pattern suggests the buyers (bulls) have gradually lost control, price can’t push higher, and sellers (bears) are poised to take over, causing the market to turn downward. In a downtrend, a reversal pattern hints that sellers are running out of steam and buyers might soon drive the price up.
Common reversal patterns include head and shoulders, double top/bottom, and triple top/bottom, among others.
Continuation vs. reversal patterns: Key differences
Both continuation and reversal patterns are essential tools in chart analysis, but they serve opposite purposes.
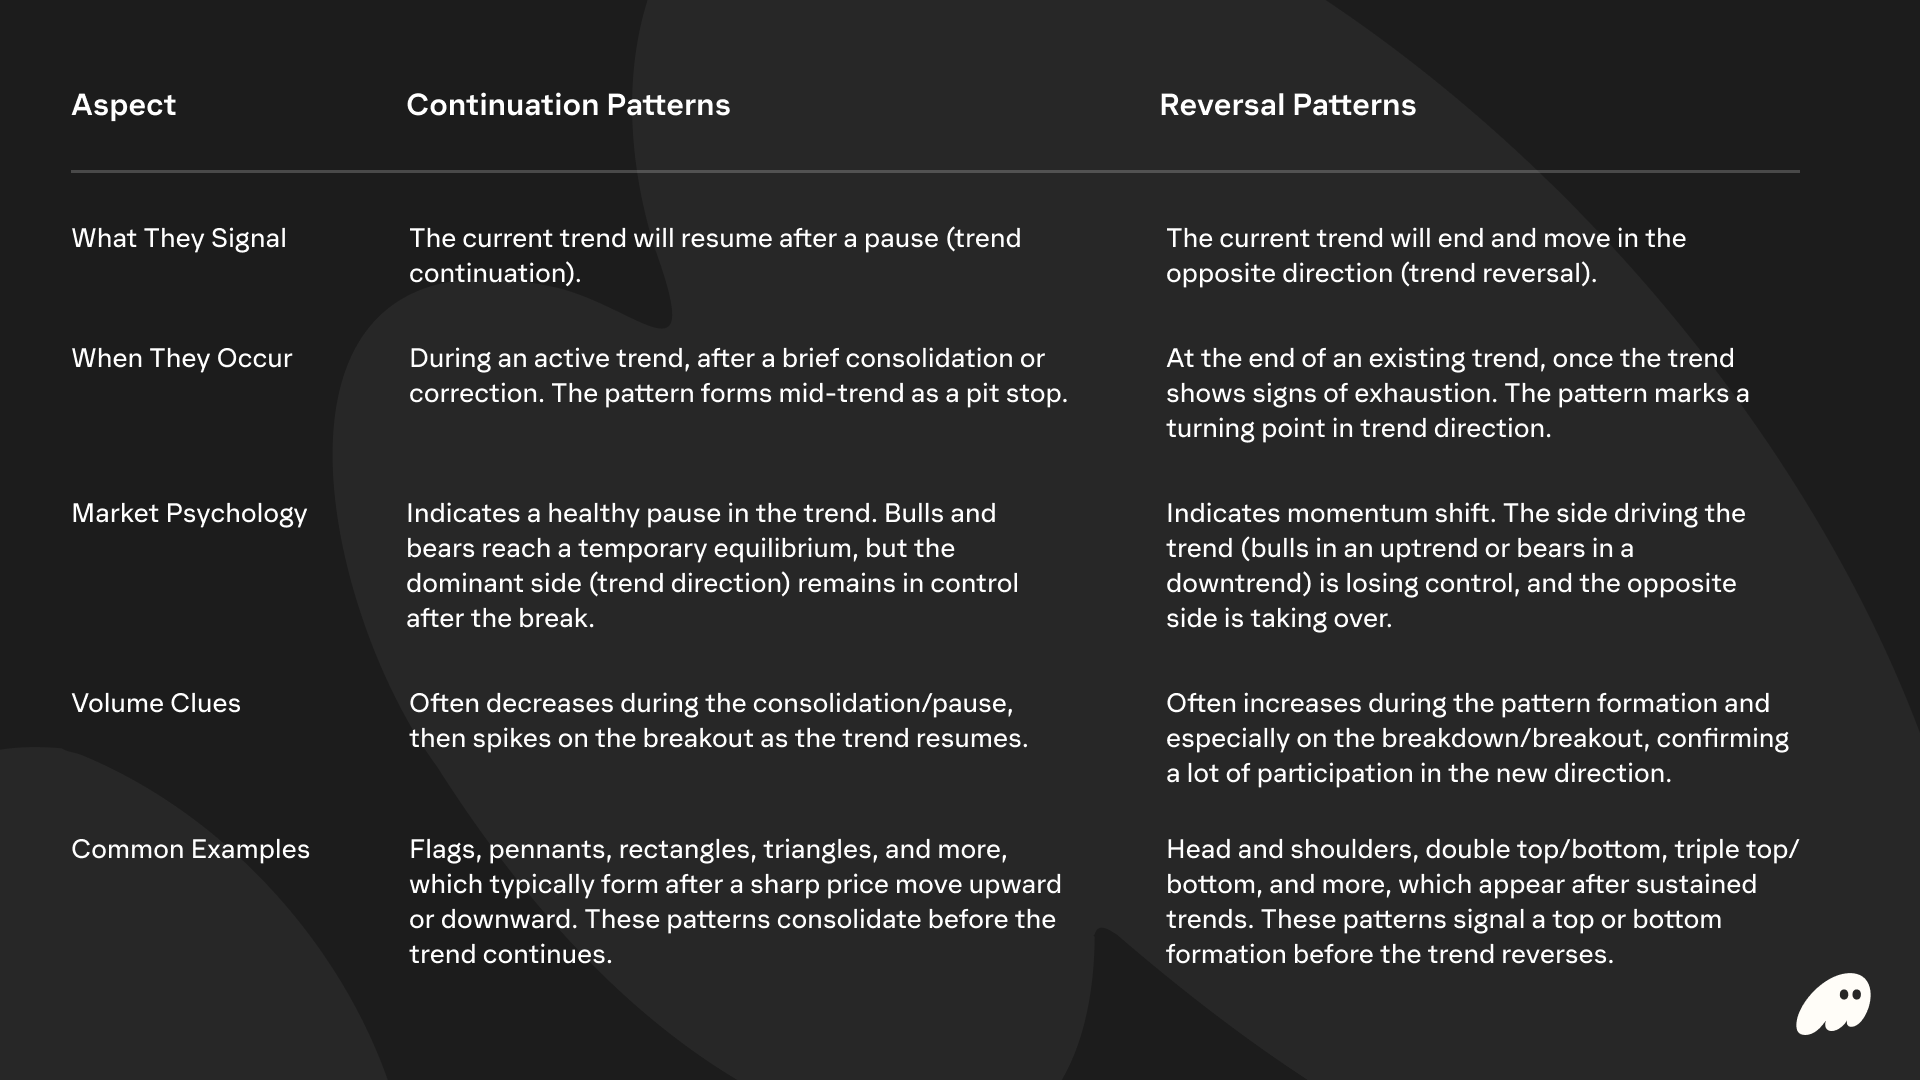
As you gain experience, understanding context will help you interpret these patterns correctly.
How to leverage continuation and reversal patterns
Traders incorporate these patterns into their strategies as a way to attempt to anticipate future price moves and plan trades accordingly.
By using continuation patterns, traders aim to join an existing trend after a brief pause for the next wave of that trend (though all derivatives trading carries significant risk).
By using reversal patterns, traders attempt to catch a new trend early—for example, by exiting a long trade at the first sign of a topping pattern or even going short to profit from a trend change.
In both cases, discipline in waiting for validation and managing risk is crucial. Patterns provide a framework, but market conditions and other factors beyond your control influence outcomes.
Continuation and reversal patterns: Common mistakes to avoid
Even with a clear understanding of continuation vs. reversal patterns, there are pitfalls to watch out for.
- Entering before confirmation: Jumping the gun can be costly. A pattern isn’t truly valid until it breaks out or breaks down. Takeaway: Wait for the completion of the pattern. Patience prevents you from buying into what turns out to be a failed pattern or false breakout.
- No pattern is 100%: Traders may get overconfident that a certain pattern must play out. In reality, chart patterns indicate probabilities, not certainties. Takeaway: Treat patterns as helpful guides, not guarantees. Combine them with sound analysis and be ready to adjust if the market proves the signal wrong.
- Ignoring volume & other confirmations: Some traders focus only on the price pattern and ignore warning signs from volume or indicators. Low volume on a breakout, for example, often means a lack of conviction and increases the chance of a false move. Takeaway: Look for volume to confirm breakouts/breakdowns. Also consider using one or two technical indicators to double-check the pattern’s story.
- Lack of risk management: Another mistake is not placing stops or using improper stop placement. If you put your stop-loss inside the pattern (too tight), normal price wiggles can stop you out before the real move happens. On the other hand, if the pattern fails completely and a stop-loss is not in place, you will likely face a large loss. Takeaway: Always set a stop-loss, usually just beyond the pattern’s boundaries or key level. This way, if the market moves against you, your loss is controlled. Additionally, plan your position size so that a loss on a failed pattern is manageable.
Charting and trading with Phantom
Now that you’ve got a better handle on continuation and reversal patterns, you're equipped with one tool in the trader's toolkit. The next step is putting that knowledge into practice. But bear in mind that successful trading combines pattern recognition with risk management, proper position sizing, and emotional discipline.
With Phantom Perps, you can go long or short when you spot a potential pattern taking shape—though remember that patterns can fail and all positions carry risk of loss.
Download Phantom today, explore charts, and challenge yourself to catch these setups in real time.
FAQs
Disclaimer: This content is for general educational purposes only. It is not financial advice, investment guidance, or a solicitation to buy, sell, or trade any assets, products, or services. Past performance is not indicative of future results. Any examples or strategies discussed are for illustrative purposes only and should not be considered as recommendations. Perpetual futures are complex, high-risk instruments that are not suitable for all investors. Phantom Perps are not available everywhere. This guide is not intended for UK audiences.


