
A bull flag pattern often points to momentum in an uptrend.
In this guide, we’ll explore how the pattern typically forms, how it connects to perpetual futures trading, and the key risks traders should keep in mind.
Anatomy of a bull flag pattern
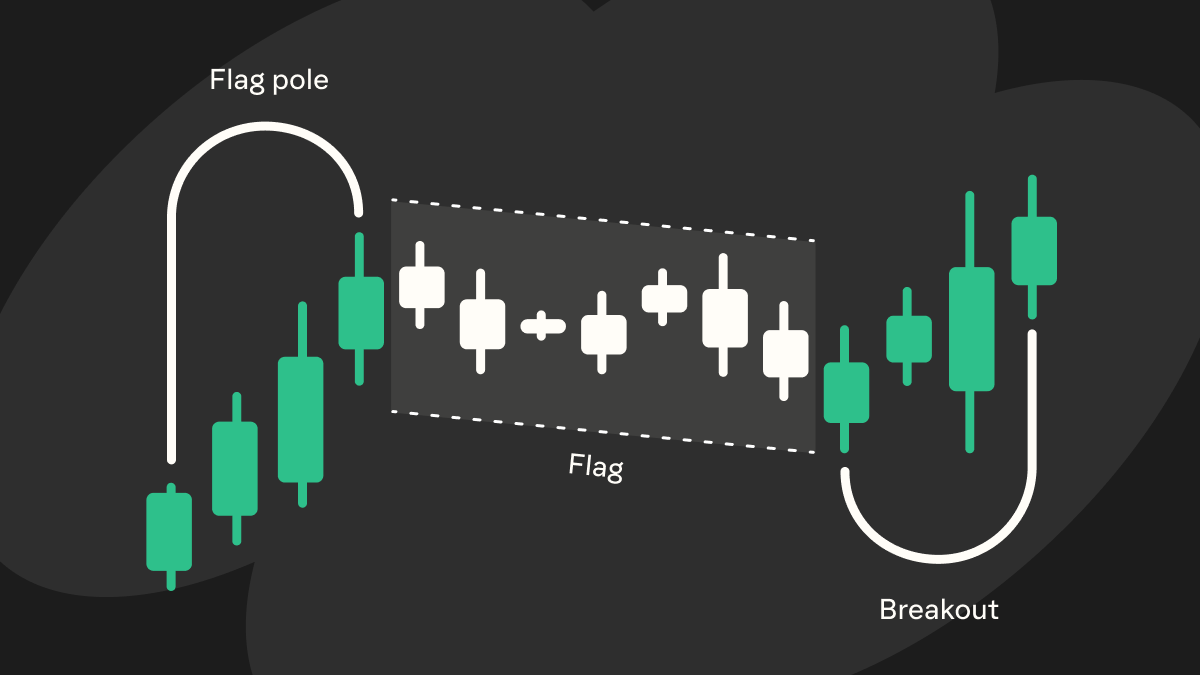
A bull flag pattern has three main components: the flagpole, the flag, and the breakout.
Below we break down each part of a bull flag pattern:
Flagpole
This is the initial sharp price increase that forms the “pole” of the flag. It’s a steep, almost vertical rise on the chart driven by strong buying interest. In practice, the flagpole often appears as one or a series of large green candles. This phase reflects strong upward momentum accompanied by high trading volume, signaling heightened buying activity.
Flag
After the flagpole, the price enters a consolidation phase, moving sideways or slightly downward. This range is known as the “flag.” The flag typically takes the shape of a small rectangle or channel that slopes gently against the previous trend. Essentially, it’s a pause in the uptrend where some traders take profits and others step in cautiously. Importantly, during this phase the price doesn’t drop drastically; it stays relatively close to the recent highs, suggesting continued buying interest. The flag portion reflects a tug-of-war where the market is catching its breath after the big rise.
Breakout
The breakout is the point at which the pattern is considered complete. It occurs when the price pushes above the upper boundary of the flag (the resistance line of the consolidation). In technical analysis, such a breakout is often interpreted as a potential continuation of the prior uptrend. Traders view a breakout as confirmation that the bulls have regained control after the brief pause. Once the price breaks out, the uptrend may resume with a strong move.
Identifying the bull flag pattern
Chart patterns
In the image above, the price shows a sharp upward move (forming the flagpole), then enters a downward-sloping or sideways range (forming the flag), and finally breaks above that range in what is viewed in technical analysis as a breakout. Bull flags are considered one of the more easily recognized chart patterns for traders within chart based analysis.
Volume analysis
Volume is often considered an important factor in confirming a bull flag pattern. Typically, volume is high during the flagpole phase, as buying activity increases during the sharp rally. Then, volume tends to contract during the flag phase, reflecting a temporary pause in aggressive trading. This volume drop happens because neither buyers nor sellers are dominant during consolidation; the market is catching its breath. In many technical analysis examples, what is often viewed as the ideal scenario is a renewed spike in volume at the breakout, when the price pushes above the flag.
Timeframes
One notable aspect of bull flags is that they can appear on different timeframes, and the core pattern is the same. You might find a bull flag on a 5-minute, daily, or weekly chart. Short-term traders often spot bull flags on one-minute or five-minute charts. In contrast, swing traders or longer-term investors might identify bull flags on daily or weekly charts to ride multi-day uptrends. But overall, whether on a 15-minute chart or a weekly chart, a bull flag typically reflects a pause within a broader upward movement and is referenced across a variety of trading and investing approaches.
Trading the bull flag pattern
Once a bull flag is identified, traders often examine potential entry points, place stop-loss levels, and set price objectives.
Entry points
The classic entry strategy for a bull flag is to enter the trade when the price breaks out of the flag formation. In practice, this means buying when the price moves above the upper resistance line of the flag. Many traders will wait for the price to close above that level to confirm that the breakout is real and not just an intraday move. By entering at or just after the breakout, traders are aiming to catch the next “flagpole-like” move, essentially the continuation of the uptrend.
Stop-loss placement
Proper stop-loss placement is crucial in trading bull flags to manage risk. A common technique is to set the stop-loss order just below the lower boundary of the flag pattern (i.e. below the support line of the consolidation). This lower boundary often corresponds to the recent swing low during the flag. By placing a stop a bit under that level, traders are essentially saying: “If the price falls below the flag’s support, then the pattern has likely failed, and I want to exit to limit my loss.”
Profit targets
Determining a profit target for a bull flag trade helps in planning where to take profits. A popular method is to use the “flagpole measurement” technique. This involves measuring the distance of the initial flagpole (the price rise from the start of the rally to the peak of the flag) and then projecting that same distance upward from the breakout point of the flag. The projected level gives a rough price target for the move. This measured target is not a hard rule, but a guideline.
Bull flag pattern: Common pitfalls & how to avoid them
Even though bull flags are considered a reliable pattern, there are pitfalls and false signals you need to watch out for.
Here are some common issues and tips on how to avoid them:
False breakouts
A false breakout (or “fake-out”) happens when the price appears to break above the flag’s resistance but then quickly reverses direction instead of continuing upward. In other words, the price pokes its head out of the flag only to fall back into or below the consolidation range.
To mitigate the risk of false breakouts, traders will generally seek confirmation of the breakout. One approach discussed in chart analysis is to observe whether the price bar (candlestick) closes outside of the flag before trusting the breakout signal.
And remember, not every breakout will succeed, even well-formed patterns can break down if market conditions change.
Volume divergence
Volume divergence refers to the pattern’s volume action not aligning with the ideal scenario described earlier.
A healthy bull flag shows declining volume during the consolidation and higher volume on the breakout. A potential pitfall occurs when this isn’t the case; for example, when trading volume is unusually high during the flag’s formation or when the breakout occurs on low volume. High volume during the consolidation could indicate significant selling or distribution (lots of activity while price is going sideways/down), which is a warning sign.
In fact, if the volume in the flag phase is higher than in the prior rally, it suggests strong selling pressure or lack of buyer interest, undermining the bullish narrative. Likewise, a breakout that comes with little increase in volume might lack the momentum to follow through.
To avoid being trapped by volume-related issues, always check the volume trend.
Pattern integrity
Not all flag patterns are created equal.
The reliability of a bull flag can diminish if the pattern deviates too much from the ideal shape or proportions.
One common issue is excessive retracement: if the flag’s pullback goes too deep relative to the flagpole, it may indicate that bullish momentum has weakend. As a rule of thumb, traders often prefer that the flag portion does not retrace more than roughly 50% of the flagpole’s height. If the price gives back more than half of the prior rally during the flag phase, the uptrend’s momentum might be in question. A shallow, “tight” flag is often described in analysis as more consistent with a continuation pattern than a deep, loose flag.
Another aspect of pattern integrity is the duration and slope of the flag. Bull flags in many historical examples tend to resolve relatively quickly. If a flag goes on for too long, it might actually be a different pattern. Similarly, a flag that drops straight down might actually signal a sharper correction rather than a mild consolidation. The bull flag slopes gently downward or moves sideways; an overly steep or erratic flag could be a sign that the pullback is turning into a reversal rather than just a pause.
To avoid pitfalls related to pattern integrity, stick to quality flags. Look for flags that are tight and controlled: modest pullback, orderly price action, and not too long in duration. By being picky with pattern quality, you can improve your success rate and avoid trades where the bullish flag scenario is compromised.
Trade bull flag patterns with Phantom Perps
Spotted a bull flag on the chart of your favorite cryptocurrency? Phantom Perps offers a streamlined way to access perpetual futures markets, where traders apply a variety of technical analysis patterns—including bull flags—as part of their market research.
Phantom Perps leverage perpetual futures contracts, a popular method for longing and shorting cryptocurrencies.
While many perpetual futures platforms are built with advanced features that can be tricky to navigate, Phantom keeps things simple with an intuitive, mobile-first design that lets you open, close, and manage perpetual futures positions directly from your wallet—powered by Hyperliquid. No extra apps, no complicated interfaces—just an accessible way to engage with perpetual futures in one place.
Want to learn more about Phantom Perps and how to get started? Our guide has you covered!
FAQs
Disclaimer: This content is for general educational purposes only. It is not financial advice, investment guidance, or a solicitation to buy, sell, or trade any assets, products, or services. Perpetual futures are complex, high-risk instruments that are not suitable for all investors and can result in losses exceeding your initial investment. Not intended for UK audiences.


