Crypto markets move fast, and while that can bring excitement, it also means there’s plenty of room for risk.
Being prepared gives you the upper hand, allowing you to capture opportunities while minimizing your exposure to losses. One key example of being prepared is knowing your crypto charts, such as the bear flag pattern. This pattern may help you identify potential market drops, so you don’t get caught off guard.
However, it's crucial to understand that technical analysis, including chart patterns, should be used alongside fundamental analysis and proper risk management—never in isolation. And remember, no pattern guarantees future price movements, and markets can remain unpredictable regardless of technical signals.
Ready to learn more about bear flag patterns and their limitations? Keep reading!
Anatomy of a bear flag pattern
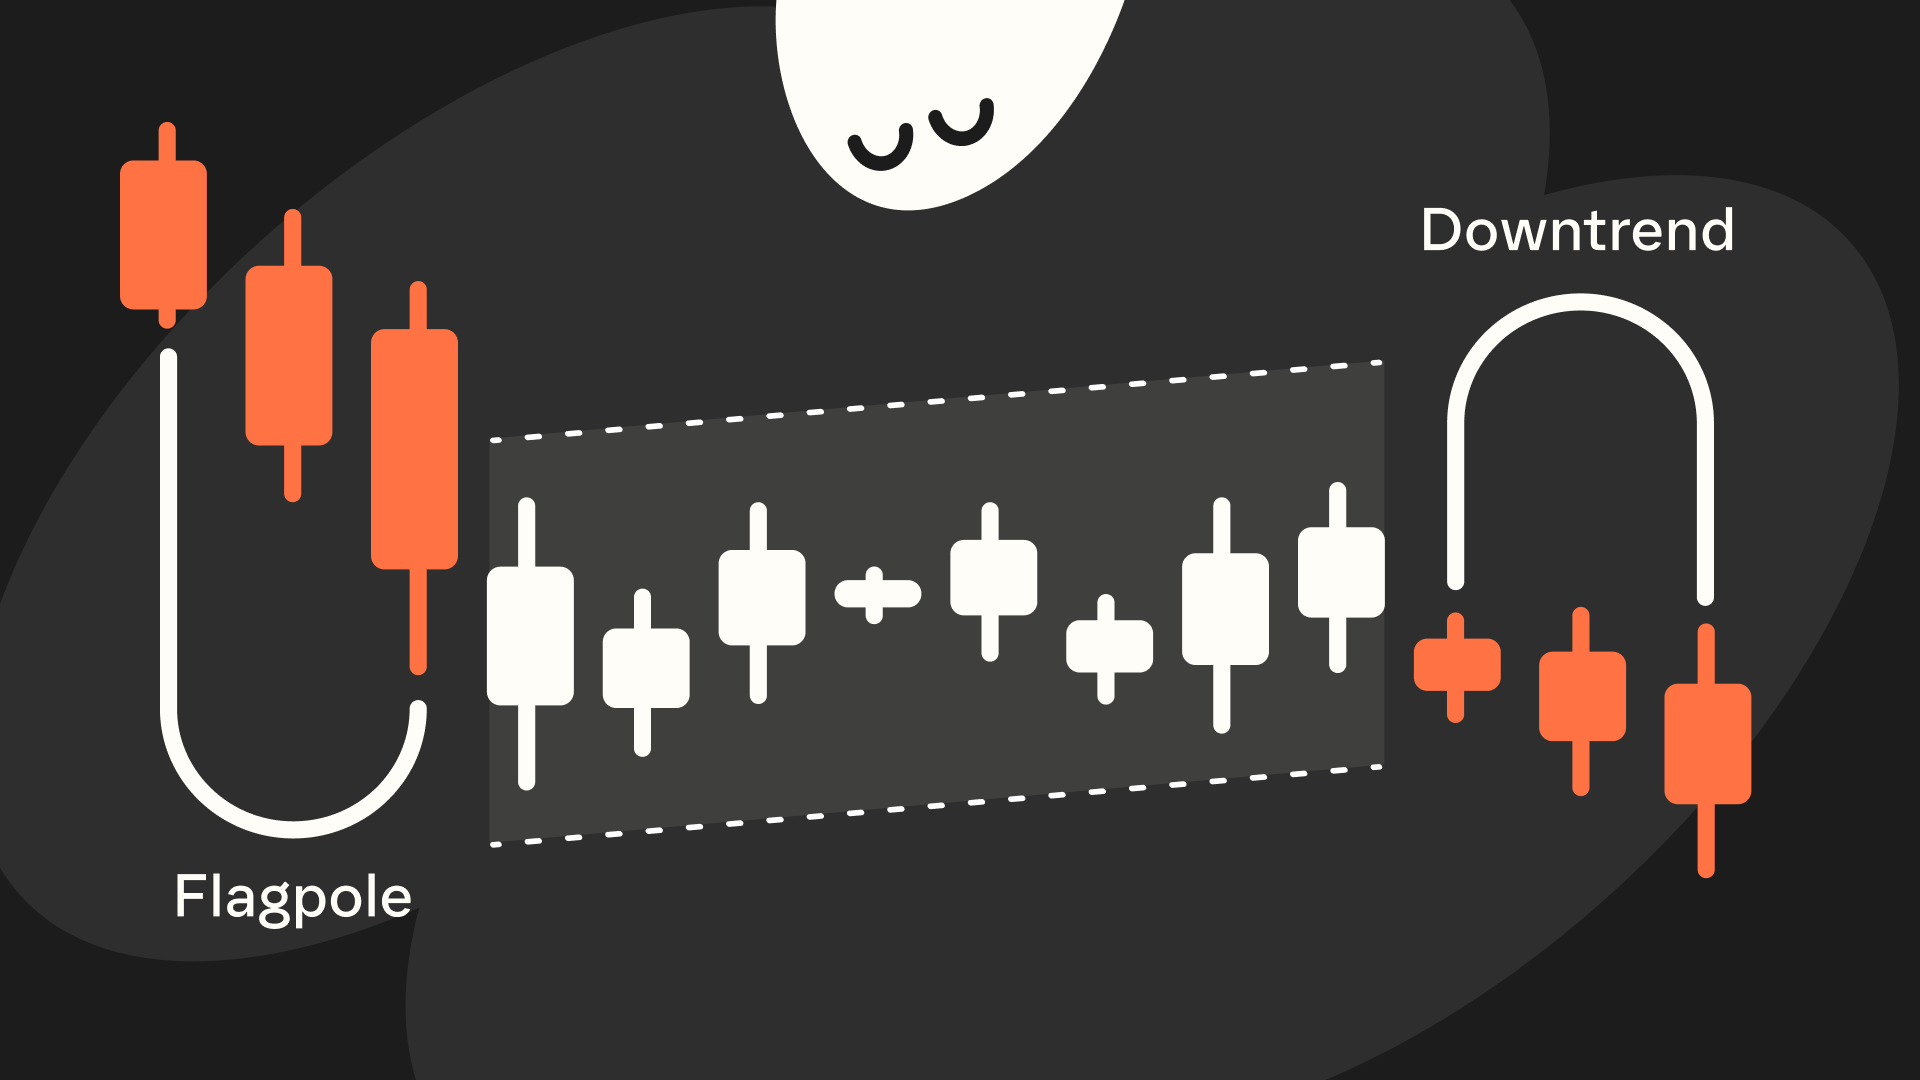
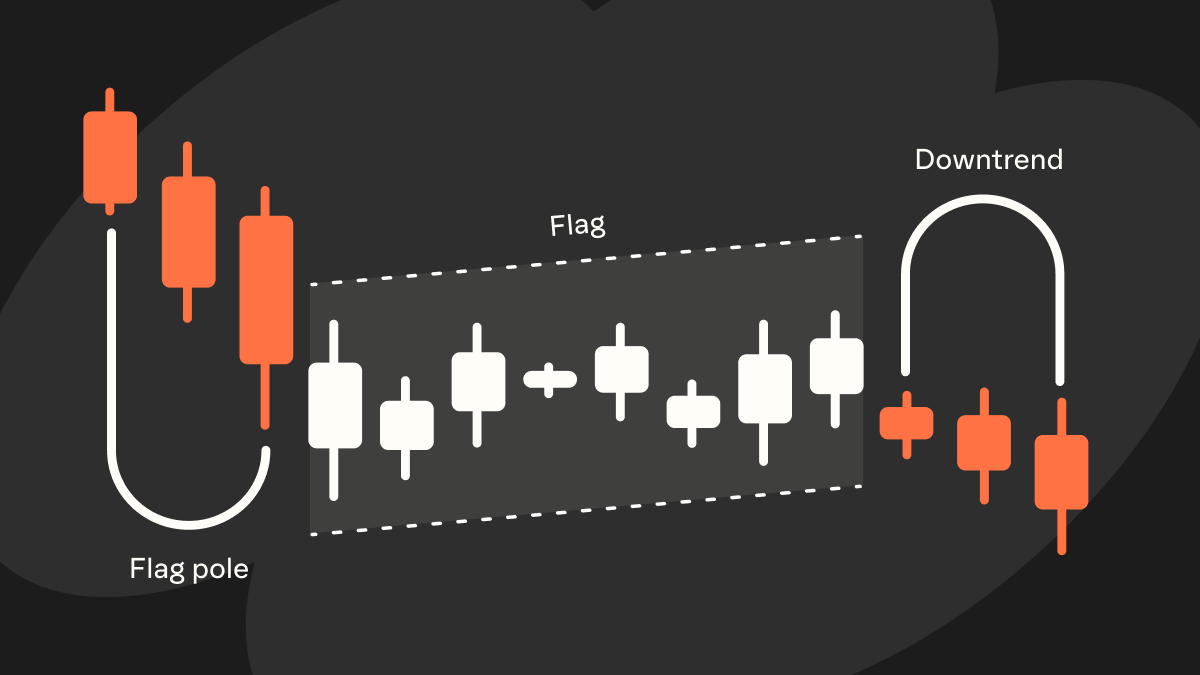
Imagine you’re looking at a price chart during a downtrend and you see a dramatic drop in price, followed by a small pause, and then another drop. That is the essence of a bear flag pattern; a chart formation that suggests a bearish trend may continue. It gets its name because the shape on the chart looks like a flag on a flagpole.
Here are the three main parts that form a bear flag pattern:
- Flagpole: This is the initial sharp price drop. Think of it as a steep cliff where the price falls rapidly in a short time. The flagpole represents strong selling momentum driving the market down.
- Flag: After the big drop, the price enters a consolidation phase—the “flag.” Here, the price might drift sideways or even slightly upward in a tight range. It’s like the market is catching its breath. The flag often forms a small rectangular or channel shape slanting gently upward, and notably, the price doesn’t recover much of the lost ground (usually it retraces less than about half of the flagpole’s drop). In other words, the bounce is relatively weak, which fits the bearish context.
- Breakdown/Downtrend: Finally, the pattern appears to completes when the price breaks down out of the flag to the downside. This means it falls below the lower support line of the consolidation, potentially continuing the prior downtrend. It’s as if the flag has finished waving and gravity pulls the price downward again. It is important to note, false breakdowns are common and should be confirmed with volume and follow-through.
This clear structure makes the bear flag one of the more recognizable continuation patterns for traders when it works as expected.
Identifying the bear flag pattern
So how do you spot a bear flag on a chart?
First, look for a steep decline—the flagpole. This needs to be an obvious, sharp sell-off that stands out from normal price moves. Next, check for a consolidation right after that drop. The consolidation (the flag) will appear as a brief period where the price moves in a narrow range, often slightly upward or sideways. During this phase, you might notice the highs and lows of the price can be bound by two parallel lines, giving it that flag shape. The flag portion typically has a smaller size compared to the flagpole and doesn’t erase the entire drop; it’s more like a minor upward correction in an ongoing downtrend.
Another useful clue is trading volume. A potentially valid bear flag often shows a distinct volume pattern: high volume during the flagpole drop, lower volume during the flag consolidation, and then a pick-up in volume when the price breaks down out of the flag. In practice, this means a lot of traders were selling during the initial plunge (heavy volume), fewer traders are active while the price is pausing and drifting (light volume), and then sellers return with force as the next drop begins (volume spikes again). This volume behavior may confirm that the quiet period was just a pause and that the downtrend could be resuming with enthusiasm. If you see this pattern of volume aligning with the price action, it’s a stronger indication that you’re dealing with a valid bear flag.
Also, remember that bear flags can appear on multiple timeframes. You might find one on a 15-minute intraday chart or on a daily chart—the concept is the same. However, patterns on extremely short timeframes can be less reliable. Generally, bear flags that form over at least a couple of days (or even weeks) tend to be more dependable, whereas very short-lived flags on minute-by-minute charts might be noisy. Always consider the broader context: ensure the overall trend is downward and that the flag is a pause in that larger downtrend. By combining the visual pattern with volume clues and the trend context, you’ll be better positioned to identify bear flags correctly.
Trading the bear flag pattern
Once you’ve recognized a bear flag, the next step is knowing how to trade it carefully and with proper risk management.
Here are some practical tips to help you approach bear flags:
- Entry point: The ideal entry is when the bear flag appears to confirm itself; that is, when the price breaks below the flag’s lower boundary (support). You typically want to enter a short trade at or just after this breakdown. However, wait for confirmation with a full candle close below support and ideally increased volume. By waiting for this moment, you increase the probability that the downtrend may be resuming and avoid jumping in during the consolidation when things are uncertain. In simple terms, don’t “guess” the breakdown; let the market show you it’s actually happening.
- Stop-loss placement: Whenever you trade a bear flag, protect yourself in case you’re wrong. A sensible place for a stop-loss order is just above the flag’s upper boundary (the top of the consolidation range). This means if the price turns around and rises above the flag, you’ll exit the trade quickly. By placing your stop a bit above the flag, you cap your risk—if the pattern fails and the price shoots up, you won’t hold onto a losing short position for long. This is a key risk management step: it ensures a false move won’t hurt you beyond a small, predetermined amount.
- Profit targets: To plan your potential reward, you can estimate how far the price might go after the breakdown. A popular method is projecting the flagpole downward from the breakdown/downtrend point. Measure the distance of the initial flagpole drop (for example, if the price fell $10 during the flagpole, that’s your flagpole height). Then, from the point where the price breaks down out of the flag, project that same $10 drop downward. The result gives you a rough price target for the move. This technique assumes the second leg down could be similar in size to the first leg. This is only a rough guideline. Actual moves can be much smaller or larger, and many bear flags don't reach their projected targets.
After planning entry, exit, and target, managing your risk and staying patient are crucial. By sticking to your strategy, using stop-losses, and keeping a cool head, you’ll increase your chances of trading the bear flag pattern successfully while protecting yourself from surprises.
Bear flag pattern: Common pitfalls & how to avoid them
Even with a solid pattern like the bear flag, things don’t always go perfectly. In fact, they fail more often than many traders expect.
Here are some common pitfalls traders face with bear flags and how you can avoid them:
- False breakdowns: This is when the bear flag pattern appears to trigger but then fails to follow through downward. For example, the price might briefly drop below the flag’s support and then whipsaw back up, or worse, it might even break above the flag’s upper boundary instead of breaking down. Such a move invalidates the bear flag signal. In other words, the pattern didn’t work as expected. To avoid getting caught in a false breakout, it’s wise to wait for confirmation that the breakdown is real. This could mean waiting for the price to close below the flag support or observing a surge in volume accompanying the drop. Remember, flag patterns (like any chart pattern) can give false signals, so waiting for that extra confirmation can save you from jumping into a bad trade. And of course, always use your stop-loss; if a false breakout happens and price reverses up through the flag, your stop will take you out and limit the damage.
- Weak volume on the breakdown: A bear flag’s power is partly shown by volume. If the price breaks down from the flag on very low volume, it’s a warning sign. A weak-volume breakdown means not many traders are participating in the move, which calls into question its strength. In these cases, the price might not go very far before reversing, since the big sellers haven’t actually jumped in. Traders generally prefer to see a strong spike in volume when the flag breaks down, as it signals conviction behind the move. To avoid this pitfall, pay attention to volume: if the volume is disappointingly low during a supposed breakdown, you might choose to hold off on taking the trade or at least be more cautious (for instance, maybe use a tighter stop or smaller position size). In short, a breakout with weak volume is suspect, so don’t ignore that red flag—no pun intended.
- Overly long or deep flags: Not every consolidation is a textbook flag. If the “flag” part of the pattern drags on for too long or retraces too much of the initial drop, the pattern’s reliability decreases. For example, if the price’s bounce during the flag climbs back more than about 50% of the way up the flagpole, many traders no longer consider it a valid bear flag. A shallow retracement (say the flag only recovers 38% or less of the drop) is much more convincing of continued weakness than a deep retracement that regains most of the losses. Similarly, an overly long flag can indicate that sellers are losing momentum. In fact, the longer the consolidation lasts, the less reliable the continuation signal becomes. To avoid these issues, stick to bear flags that are tight and timely. That means the flag portion should be relatively short in duration (a few days, for example, rather than multiple weeks of sideways grind) and not too high in its rebound. If you spot a pattern that sort of looks like a bear flag but the pullback is very large or it’s been going on forever, it might not be a true bear flag—it could be a sign of a trend change or just a messy range. It’s usually better to be cautious and wait for a clearer pattern than to force a trade on a dubious setup.
In all these cases, the overarching advice is to be patient and use sound risk controls.
Bear flags can be effective when conditions align, but only if you approach them with discipline and realistic expectations about their limitations. Always confirm the pattern with price action and volume, don’t assume every consolidation in a downtrend is a bear flag, and protect every trade with proper stops and risk management. Remember that even perfectly executed bear flag trades can fail due to broader market forces beyond technical analysis.
If you do that, you’ll greatly increase your odds of navigating bear flag patterns safely and profitably.
Trade bear flag patterns with Phantom Perps
Phantom Perps are the perfect tool for trading bear flag patterns.
Phantom Perps leverage perpetual futures contracts, a popular but high-risk method for longing and shorting cryptocurrencies. Perpetual futures involve leverage, which can amplify both gains and losses significantly. Beginners should thoroughly understand these risks before using such instruments.
Most perpetual futures platforms are built with advanced features that can be tricky to navigate. Phantom keeps things simple with an intuitive, mobile-first design that lets you open, close, and manage perpetual futures positions directly from your wallet—powered by Hyperliquid. No extra apps, no complicated interfaces—just fast, straightforward trading with full control at your fingertips.
Want to learn more about Phantom Perps and how to get started? Our guide has you covered!
FAQs
Disclaimer: This content is for general educational purposes only. It is not financial advice, investment guidance, or a solicitation to buy, sell, or trade any assets, products, or services. Perpetual futures are complex, high-risk instruments that are not suitable for all investors and can result in losses exceeding your initial investment. Not intended for UK audiences.


